 The Wilcox Solar Observatory
 The Wilcox Solar Observatory

| WSO Data: | Mean Field | Magnetograms | Synoptic Charts | Coronal Model | Tables | Other |
|---|
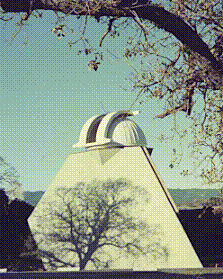
The Wilcox Solar Observatory (WSO) began collecting daily observations of the Sun's global (or mean) magnetic field in May 1975 (Scherrer+1977), with the goal of understanding changes in the Sun and how those changes affect the Earth. That science is called space weather. Since May 1976 daily low-resolution maps of the Sun's magnetic field have been made at WSO, along with observations of solar surface motions. The observatory is located in the foothills just south of the Stanford University main campus.
Current WSO research topics include space weather, the large-scale magnetic field, and the solar cycle. The observatory and staff are also associated with the Helioseismic and Magnetic Imager (HMI) project on the Solar Dynamics Observatory (SDO) and the COFFIES DRIVE Science Center. HMI provides continuous real-time high-resolution solar observations of the velocity, intensity, and magnetic field from geosynchronous Earth orbit. The Solar Observatories Group previously operated the Solar Oscillations Investigation that uses the Michelson Doppler Imager (MDI) instrument on the SOHO spacecraft to observe the inside of the Sun.
More information is available concerning the Solar Observatories Group, the Hansen Experimental Physics Laboratory (HEPL), the Kavli Institute for Particle Astrophysics and Cosmology (KIPAC), and about the Experimental and Observational Astrophysics and Cosmology and Theoretical Astrophysics and Cosmology programs in the Stanford University Physics Department.
Stanford University operates WSO with funding provided by the National Science Foundation with Grant #1836370.
NASA funding for WSO ended in 2018. Historically WSO has been supported by
NASA Heliophysics,
the NSF,
and the Office of Naval Research.
Prof. J. Todd Hoeksema serves as WSO director.
 Pictures of WSO, staff members and other local wildlife.

|
Visit the SOLAR Center
-- our award winning educational web site providing on-line activities to
encourage and share the wonder of solar science exploration.
You can also learn about Space Science at Windows to the Universe. |
The Sky Above |
|---|
sn=16522 time=2025:03:26_21h:35m:15s CT2295:038 trouble=34000001 sky= 5 NOTE: 1 not complete 21 do not use for velocity strips 22 do not use velocity data 23 do not use for synoptic charts | |

| Most recent WSO Magnetogram |
| [.gif] | [.ps] | |
| 2020 | | 2021 | | 2022 | | 2023 | | 2024 | | 2025 | | ||||
| 2010 | | 2011 | | 2012 | | 2013 | | 2014 | | 2015 | | 2016 | | 2017 | | 2018 | | 2019 | |
| 2000 | | 2001 | | 2002 | | 2003 | | 2004 | | 2005 | | 2006 | | 2007 | | 2008 | | 2009 | |
| 1990 | | 1991 | | 1992 | | 1993 | | 1994 | | 1995 | | 1996 | | 1997 | | 1998 | | 1999 | |
| 1980 | | 1981 | | 1982 | | 1983 | | 1984 | | 1985 | | 1986 | | 1987 | | 1988 | | 1989 | |
| 1975 | | 1976 | | 1977 | | 1978 | | 1979 | |
 Other Quantities