|
|
|
|
| Stanford Solar Physics | Solar-Center | |
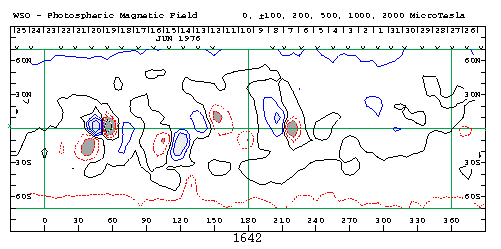
| Synoptic charts of the solar magnetic field are assembled from individual magnetograms observed over the course of a solar rotation. The contour maps show the distribution of magnetic flux over the photosphere. The field above 70 degrees is not resolved. Missing data are printed as XXX in the text files. Missing data are interpolated in the F.txt files. |

A reduced sample of Carrington Rotation 1642 (June 1976).
|
|---|
|
|
|
|
| Stanford Solar Physics | Solar-Center | |