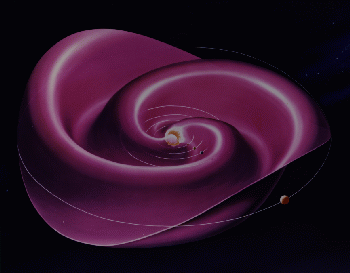
 The heliospheric current sheet separates regions of the solar wind
where the magnetic field points toward or away from the Sun. The
complex field structure in the photosphere simplifies with increasing
height in the corona until a single line separates the two polarities
at about 2.5 solar radii. That line is drawn out by the radially
accelerating solar wind to form a surface similar to the one shown in
this idealized picture. The surface is curved because
the underlying magnetic pattern rotates every 27 days with the Sun.
It would take about 3 weeks for material near the current sheet traveling at 400 km/s in the solar wind to reach the orbit of Jupiter, as depicted here. In reality the surface becomes increasingly distorted because of variations in the solar wind speed along the surface and other dynamic effects operating in the interplanetary medium.
The shape of the current sheet usually evolves slowly - over months - as the large-scale pattern of the Sun's field changes in response to the emergence and decay of solar active regions. Coronal mass ejections often disrupt the background pattern temporarily, but sometimes the changes are permanent.
During most of the solar cycle the source of the heliospheric current sheet resembles a slightly tilted dipole with varying degrees of quadrupole distortion. Near solar maximum the polar dipole decays, leaving a much more complicated structure. This picture shows the heliospheric current sheet as it might appear during the rising phase of the cycle, when the dipole and quadrupole components are balanced; at this point the neutral line at the base of the sheet resembles the seam on a baseball.
Prof. John M. Wilcox was one of the discoverers of the heliospheric current sheet and did much to develop our understanding of it during the 1960s and 1970s. He worked with NASA artist Werner Heil to create this picture, first published in Science in 1980. An earlier 3D rendering of the HCS appeared in a 1976 paper by L. Svalgaard and J.M. Wilcox in Nature. The shape for this image was inferred from observations of the corona and solar wind and also based on coronal field models like those of Wilcox's former student, Ken Schatten.
Return to WSO Home Page